
Figure 1.
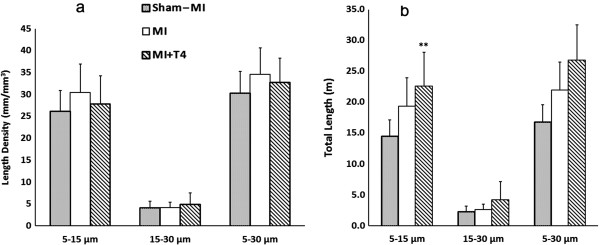
Changes in arteriolar length density and total length in the LV non-infarcted area at 8 weeks post-MI. (a) Length density; (b) Total length. Data are reported for arteriolar diameters in the 5–15, 15–30, and 5–30 μm ranges. Sham-MI (grey bars), MI (white bars), and MI+T4 (hatched bars). Results are mean (SD). N=7, 6 and 7 for sham-MI, MI and MI+T4 group, respectively. **, p < 0.01 vs. Sham-MI rats; ANOVA with Student-Newman-Keuls’ Multiple Comparison Test.