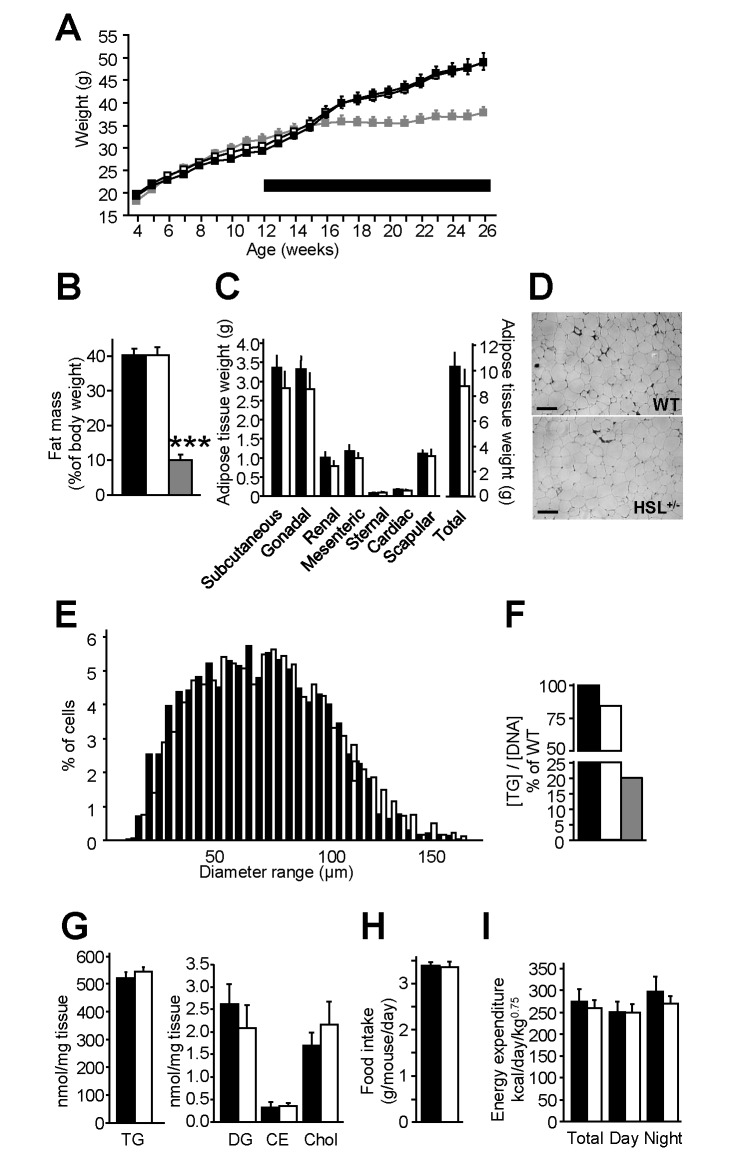
Figure 3. Energy balance of HFD-fed HSL+/− and WT mice.
Mice were first provided ad libitum access to a standard diet for 8 wk after weaning. Then they received a HFD shown as a thick line for 12 to 16 wk. (A) Body weight curves. (B) Fat mass. (C) Fat pad weight. (D) WAT morphology. Scale bar, 100 µm. (E) Frequency of adipocyte diameter observed on histological preparation of WAT. (F) In vitro adipogenesis of progenitor cells from the subcutaneous WAT stromavascular fraction. Values show results of WAT pools from 2–3 mice. (G) WAT neutral lipids. CE, cholesterol ester; chol, free cholesterol; DG, diacylglycerol; TG, triacylglycerol. (H) Food intake. (I) Energy expenditure assessed by indirect calorimetry. Values are means ± SEM. WT mice (black bars) (n = 5–10), HSL+/− mice (white bars) (n = 5–10), and HSL−/− mice (gray bars) (n = 4). *** p<0.001 versus WT mice.

