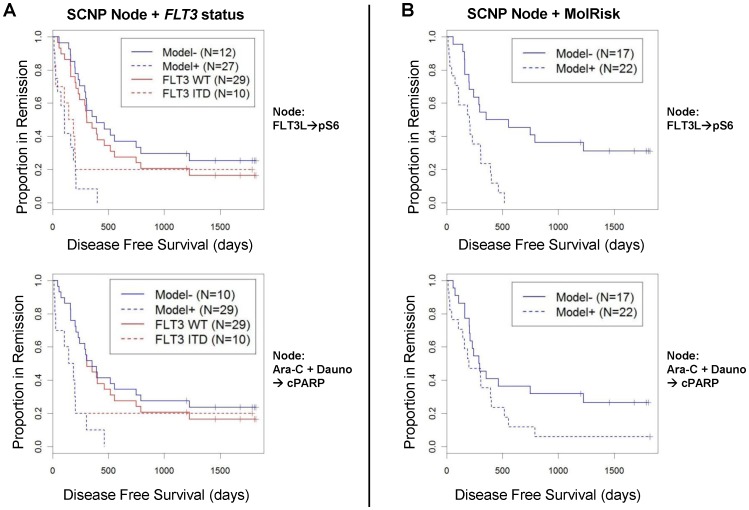
Figure 7. SCNP models compared to FLT3 mutational status or molecular risk groups in modeling DFS.
(A) Models for DFS based on SCNP readouts and FLT3 mutational status allow for better separation of patients compared to modeling based on FLT3 mutational status alone. The DFS of patients modeled based on SCNP readouts alone vs. combined with FLT3 mutational status is shown by the blue lines (Model− vs. Model+) and DFS modeled based on FLT3 mutational status only is shown by the red lines (FLT3 WT vs. FLT3 ITD). The SCNP model in the upper panel (blue lines) incorporates the SCNP node FLT3L→pS6 and in the lower panel incorporates the SCNP node Ara-C/Dauno→cPARP. (B) Models for DFS based on SCNP read outs and molecular risk group allow for clear separation of two patient groups. The DFS of patients modeled based on SCNP readouts alone vs. combined with molecular risk groups (3 groups) is shown by the blue lines (Model− vs. Model+). DFS modeled based only on molecular risk groups is not shown since it provides prediction into 3 groups. The SCNP model in the upper panel incorporates the SCNP node FLT3L→pS6 and in the lower panel the SCNP node Ara-C/Dauno→cPARP.

