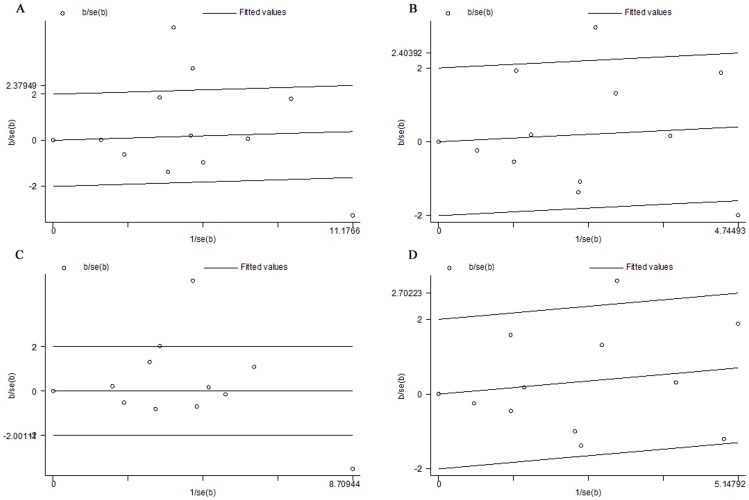
Figure 4. Galbraith plot of MTHFR C677T polymorphism and cervical cancer risk.
. A, The three studies of Shekari M et al., Ma XC et al., and Zoodsma M et al. were outliers in the T vs. C; B, The two studies of Ma XC et al. and Zoodsma M et al. were outliers in the TT vs. CC; C, The three studies of Shekari M et al., Ma XC et al., and Zoodsma M et al. were outliers in dominant genetic model; D, The study of Ma XC et al. was outliers in the recessive genetic model.

