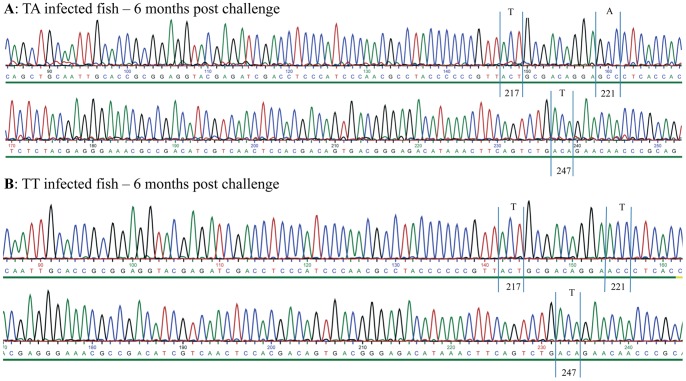
Figure 2. Chromatogram of TA- and TT-infected fish 6 months post challenge.
Detail from chromatogram TA (A) and TT-infected (B) fish (6 months post challenge) from the hypervariable region of VP2. The chromatograms show no mutation for amino acid residues 217, 221 and 247 of VP2. Further there are no double-peaks for these positions. Details of sequencing methods are given in Materials and methods.

