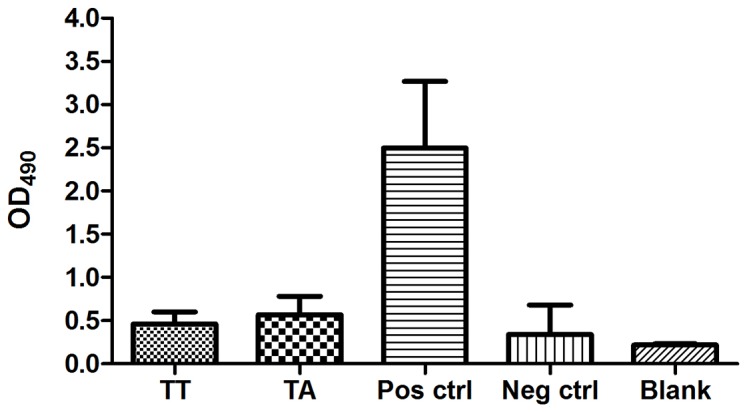
Figure 4. Antibody measurement in TA and TT-infected fish.

ELISA results (7 months post challenge) in TA- and TT-infected fish tested against TA antigen coat. Pos ctrl are positive controls (TA) and neg ctrl are naïve fish. Blank is background without primary antibodies added. n = 3. As serum is difficult to withdraw from so small fish, we confirmed the protein concentration in the vials used and they were found comparable at 1∶50 dilution protein concentrations between 0.75 to 1.75 mg/ml. The positive control fish sample had a protein concentration around 1.6 mg/ml at the same dilution. Samples were adjusted to equal concentrations.
