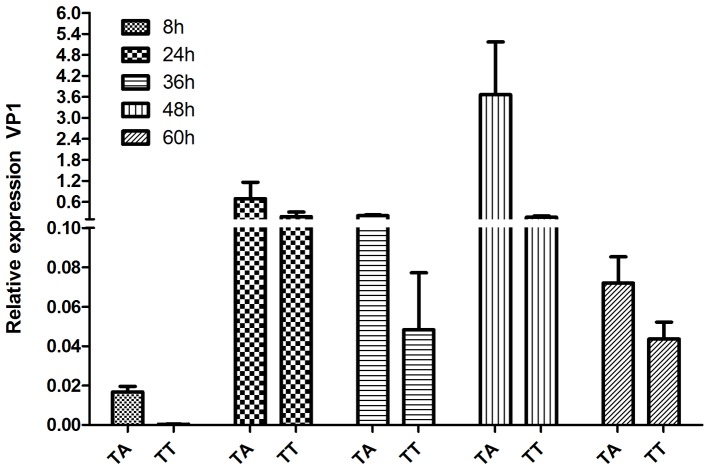
Figure 9. Recombinant IFN-α1 effect on viral replication of TA and TT infected TO cells.
Viral replication levels (VP1 expression) at different time post infection (hours post infection; hpi) of TO cells, pretreated (24 h) with recombinant IFN-α1. The TA strain shows earlier increase of replication levels (24 hpi) and peak at 48 hpi at 23-fold higher replication levels than the TT-strain at this time point. N = 3–4 replicates per time point.

