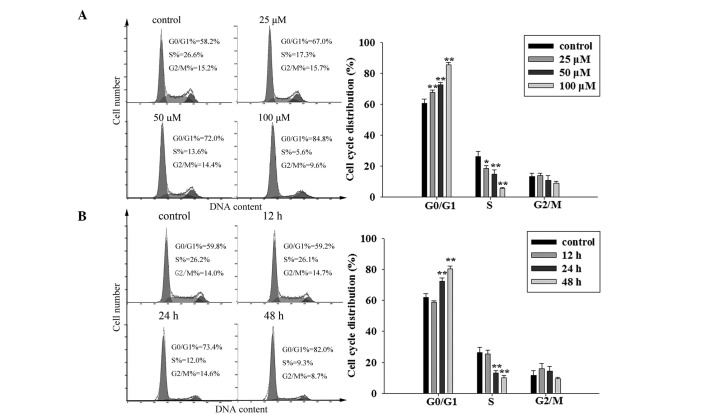
Figure 2.
Midazolam induced G0/G1 cell cycle arrest in FaDu cells. (A) Dose-dependent effect of midazolam on cell cycle distribution. FaDu cells were treated with 0 (control), 25, 50 and 100 μM midazolam for 48 h. (B) Time-dependent effect of midazolam on cell cycle distribution. FaDu cells were treated with 50 μM midazolam for 0 (control), 12, 24 and 48 h. Representative cell cycle distribution (left) and statistical graph (right; n=3), *P<0.05, **P<0.01, compared with the control.

