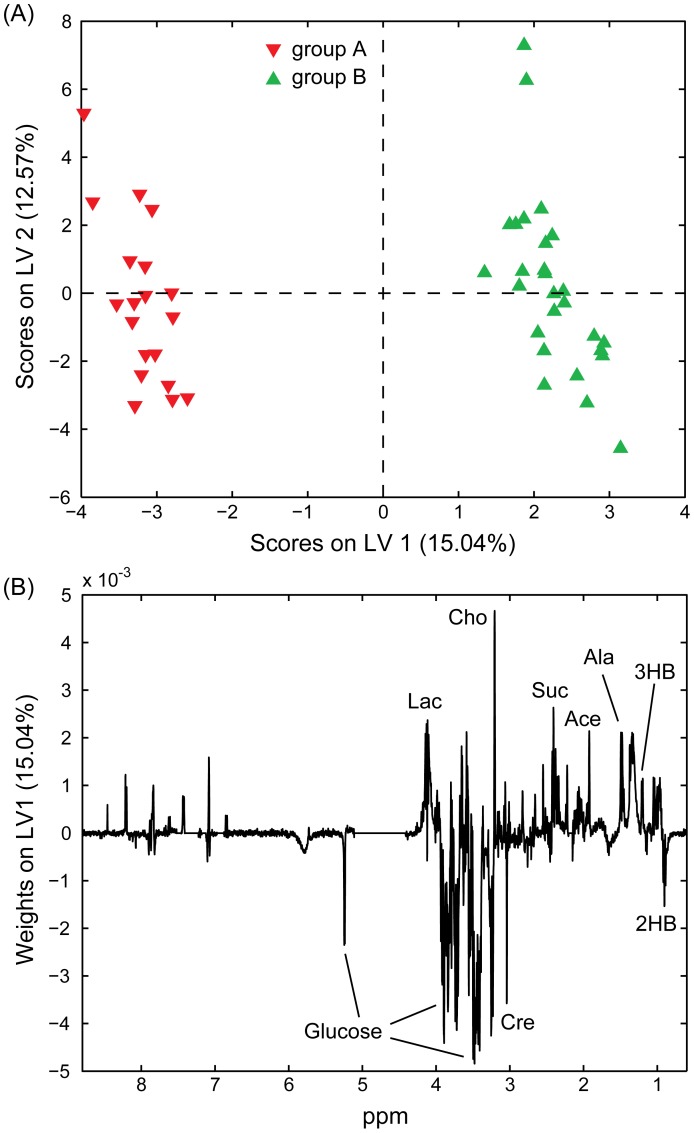
Figure 2. Partial Least Squares Discriminant Analysis of NMR spectra acquired on blood serum samples.
Scores (A) and weights (on LV1; B) plots obtained from OSC-PLS-DA performed on the NMR spectra of 46 blood serum samples. Group A (solid red, 19 samples): patients at diagnosis; Group B (solid green, 27 samples): patients after chemotherapy. Lac: lactate; Cho: choline; Cre: creatinine; Suc: succinate; Ace: acetate; Ala: alanine; 3HB: 3-hydroxybutyrate; 2HB: 2-hydroxybutyrate.

