
Figure 1. Hippocampal fast network oscillations are strongly reduced in α2−/− mice but not in α1−/− mice.
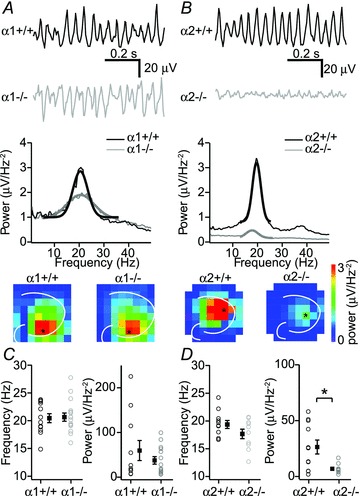
A, example traces of oscillations in CA3 in α1+/+ mice and α1−/− mice (top) and corresponding Fourier transforms (middle) and peak power at different location of the hippocampus (bottom). Traces are from electrodes indicated by an asterix. B, example traces of oscillations in CA3 in α2+/+ mice and α2−/− mice (top) and corresponding Fourier transforms (middle) and peak power at different location of the hippocampus (bottom). C, peak frequency and peak power of oscillations in α1+/+ mice and α1−/− mice (n= 11 for α1+/+ and n= 15 for α1−/−). D, peak frequency and peak power of oscillations in α2+/+ mice and α2−/− mice (n= 15 for α1+/+ and n= 10 for α1−/−). Data show SEM.