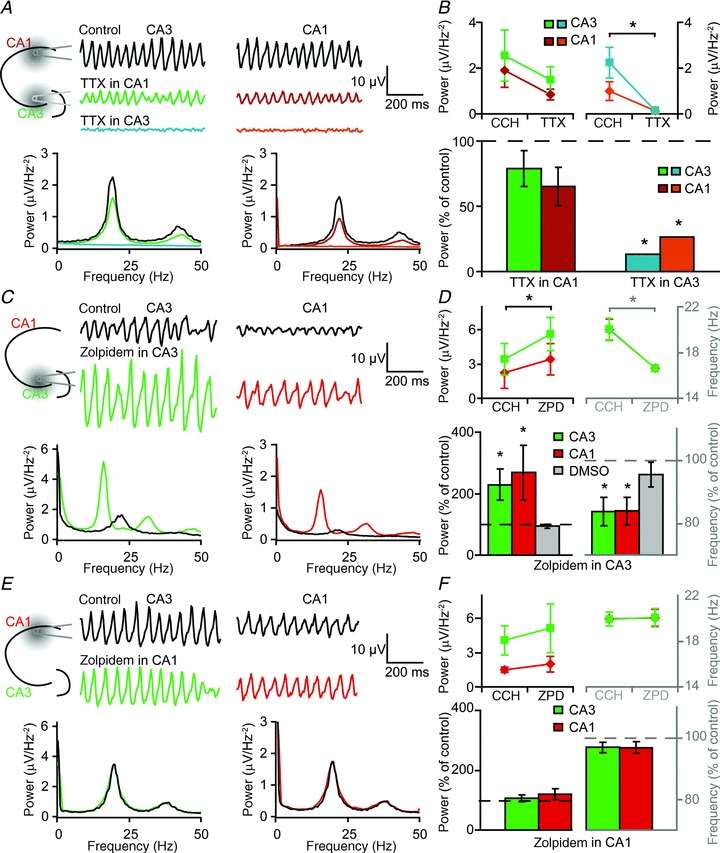
Figure 3. Local injection of TTX and zolpidem.

A, schematic view (top left) of experimental setup. TTX (1 mm) was injected with a glass electrode in either CA3 or CA1. Example traces (top right) and corresponding Fourier transforms (bottom) in control and after TTX application in different areas. B, effects of TTX injection in CA3 (n= 14) and CA1 (n= 7) on the power of oscillations in CA3 and CA1 (top), and normalized change in power by TTX (bottom). C, experimental setup (top, left), example traces (top,right) and Fourier transform (bottom) in control and after injection of 1 mm ZPD in CA3. D, effects of ZPD injection in CA3 (n= 5) and on the power and frequency of oscillations in CA3 and CA1 (top), and normalized change in power and frequency by ZPD or DMSO injection in CA3 (bottom). E, experimental setup (top, left), example traces (top,right) and Fourier transform (bottom) in control and after injection of 1 mm ZPD in CA1. F, effects of ZPD injection in CA1 (n= 6) and on the power and frequency of oscillations in CA3 and CA1. Data show SEM. CCH, carbachol; TTX, tetrodotoxin citrate; ZPD, zolpidem.
