
Figure 4. Zolpidem effects on decay time kinetics in CA3 pyramidal cells.
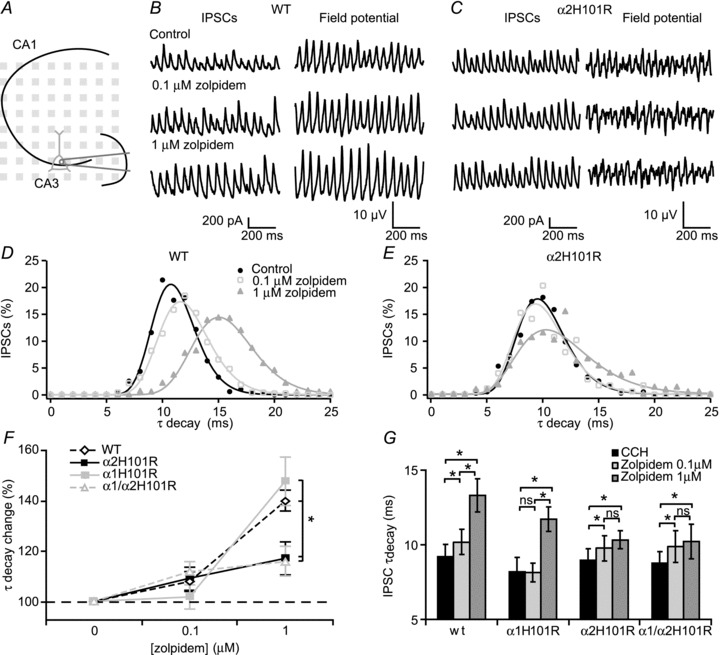
A, experimental setup. B, left, example traces of IPSCs from a CA3 pyramidal cell in control and increasing concentration of zolpidem from a WT mouse. Right, corresponding local field potential. C, same as in B, but now in a pyramidal cell from the α2H101R mouse. D, histogram of IPSC decay time kinetics fitted with a lognormal function (line) in a WT mouse. E, histogram of IPSC decay time kinetics fitted with a lognormal function (line) in a WT mouse. F, effects of increasing concentrations of zolpidem on IPSC decay time kinetics in different transgenic mice. ANOVA test showed differences between genotypes (P < 0.05, n= 7, n= 6, n= 8 and n= 7 for wild-type, α1H101R, α2H101R and α1H101R/α2H101R, respectively). Data are normalized to control. G, changes in decay time kinetics by zolpidem. Data show SEM. CCH, carbachol; IPSC, inhibitory postsynaptic current; WT, wild-type.