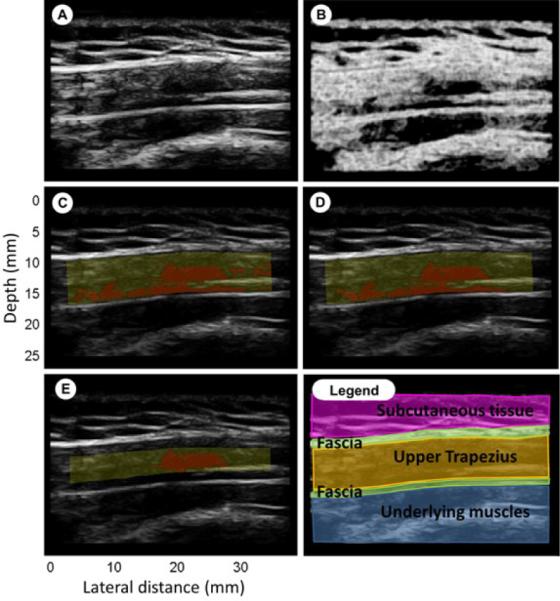
Figure 2.

Entropy filtering. (A): B-mode image; (B): entropy image; (C): yellow mask highlight the ROI, red region has entropy<4; (D): ROI with size threshold; (E): Crop of the ROI by 20% to exclude muscle near the fascial border; (Legend): Fuscia is subcutaneous tissue, green are fascia, yellow is upper trapezius, blue are underlying muscles.
