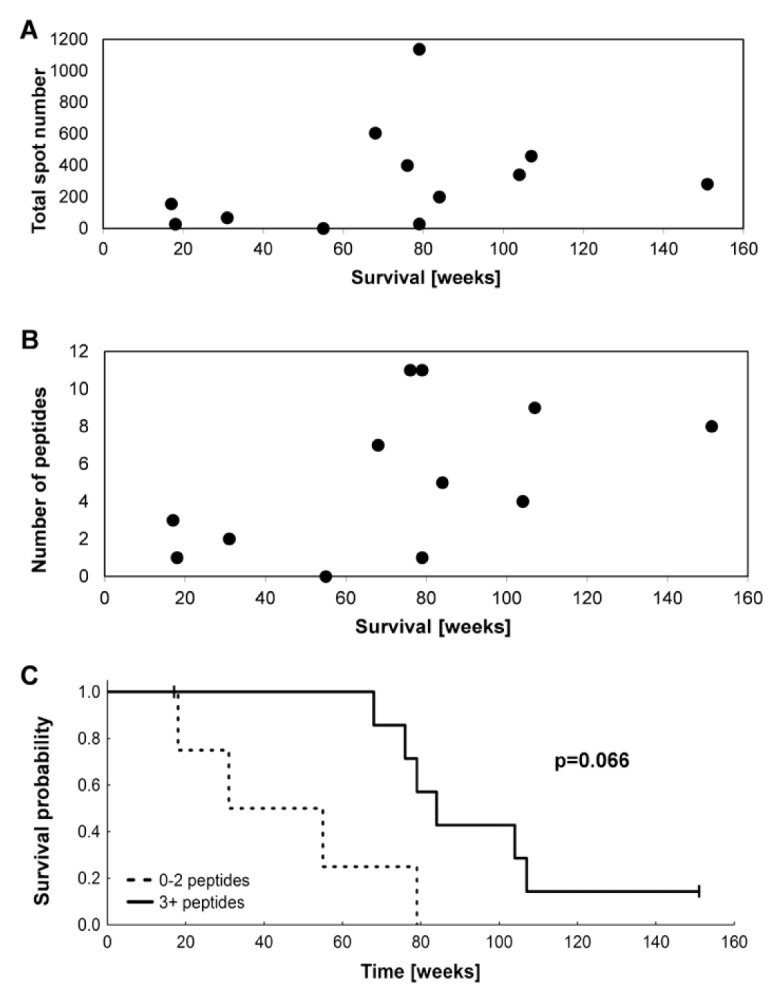
Figure 1.

Correlation of immune response to survival time. (A) Total spot number is shown for each patient (n = 12) (y axis) to demonstrate the magnitude of the vaccine-induced immune response in correlation to survival (x axis). (B) The number of peptides (y axis) to which each patient responded is shown in relation to survival (x axis). (C) Survival probability of the patients with immune responses to 0–2 peptides (dashed line) and immune responses to ≥3 peptides (solid line). p = 0.066; log-rank test.
