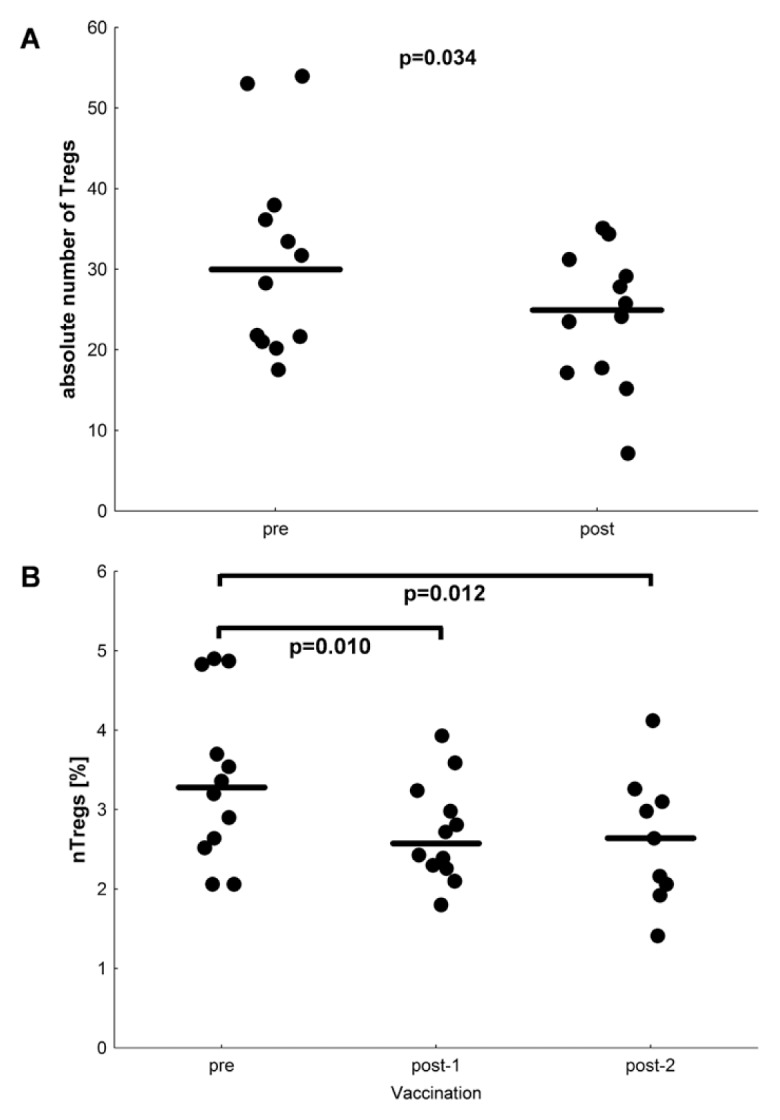
Figure 2.

Decreased frequencies of nTregs during vaccination. (A) Absolute number of CD4+CD25highCD127low/negativeFoxP3+ CD39+ Tregs per μL blood measured by flow cytometry before and after vaccination for each patient (n = 12). The median is indicated. p = 0.034; Wilcoxon signed-rank test. (B) The nTregs were quantified with a real-time PCR-based methylation assay with methylation- and demethylation-specific primers. The y axis shows the percent of nTregs, and the x axis shows three different time points of the study protocol. Post-2 is the same time point as the postvaccination time point in (A). The decrease of nTregs is statistically significant with p < 0.05 (Wilcoxon signed rank test).
