
Figure 6.
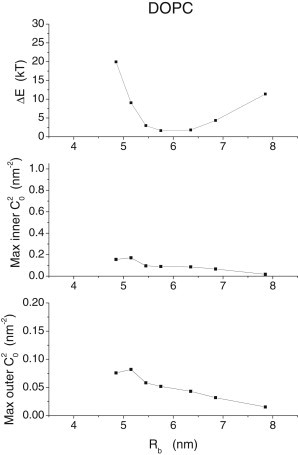
(Top row) The energy reduction achieved by minimization of Eb is plotted versus Rb for DOPC (see Fig. S9 in the Supporting Material for DPPC). These plots show very low reductions in energy for intermediate values of Rb and somewhat larger reductions for larger and smaller values of Rb. The maximum square mean curvatures of the inner (middle row) and outer (bottom row) monolayers show sharp increases at low Rb and become very small for large Rb.