
Figure 2.
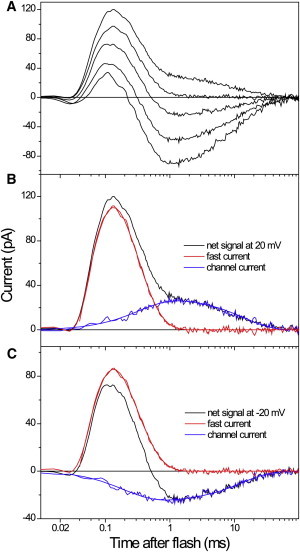
(A) Electrical currents generated by CaChR1 expressed in an HEK293 cell in response to a laser flash at the holding potential applied in 20-mV increments from −60 to 20 mV (bottom to top). (B and C) Decomposition of the net signals recorded at 20 mV (B) and −20 mV (C) in two components. Shown are the recorded traces (black lines), the properly scaled fast positive current, obtained by measuring the signal at 0 mV (red lines), and the channel current, revealed by subtraction of the fast current from the net signal (blue lines). The smooth lines are the results of fitting of each of the two components with two exponentials.