
Figure 2.
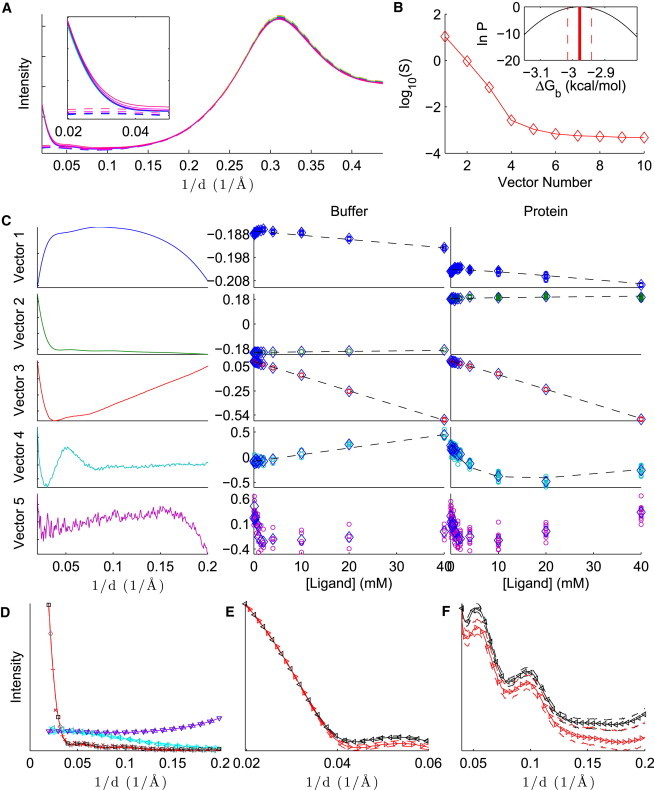
Analysis of lysozyme-NAG binding, with SVD preprocessing. (A) Average intensities for protein and ligand in buffer (solid lines), and ligand in buffer (dashed lines), in arbitrary units. The intensities increase as a function of ligand concentration. Inset: The same plot, zoomed in to the small-angle region. (B) Singular values for the first 10 basis vectors. Inset: Logarithm of the Bayesian posterior (Eq. 13) in the region where the density is within a factor of of the maximum density. (C) First five SVD basis vectors (left) and columns of V for ligand in buffer (middle column) and protein and ligand in buffer (right column). For the middle and right columns, individual measurements are denoted with circles, the mean over each concentration is indicated with diamonds, and the dashed line shows the fit of the model to the data. (D–F) Reference patterns: background (divided by 5, upward triangles), ligand (multiplied by 100, rightward triangles), apo protein (squares), and holo protein (plus signs). The figure shows an overview (D), the low-angle region of the apo and holo protein patterns on the logarithmic scale (E), and a wider-angle region of the apo and holo protein patterns on a linear scale (F). The solid line with embedded markers is the reference pattern, given the point estimate of , and the dashed lines above and below the reference patterns are the estimated upper and lower bounds, respectively, for the 68% CI. The left plot also shows other patterns that are expected to be similar to the reference patterns: the buffer, without protein or ligand (downward triangles), the difference between the highest-concentration ligand and the buffer (leftward triangles), the difference between the protein without ligand and the buffer (diamonds), and the difference between the protein at the highest ligand concentration and the buffer (x symbols). These patterns are scaled so that the sum of their absolute values matches the corresponding reference pattern (background, ligand, apo, and holo, respectively). For clarity, markers are not shown at every point.