
Figure 4.
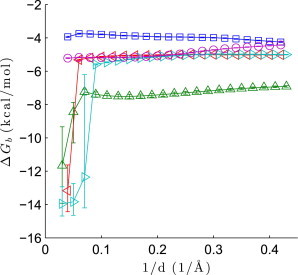
Dependence of estimates on the maximum value of , for lysozyme-NAG (upward triangles), lysozyme-(NAG)2 (leftward triangles), lysozyme-(NAG)3 (rightward triangles), galectin-lactose (circles), and ADH-NAD+ (squares). The marker is the point estimate and the error bars are the upper and lower bounds of the 68% CIs.