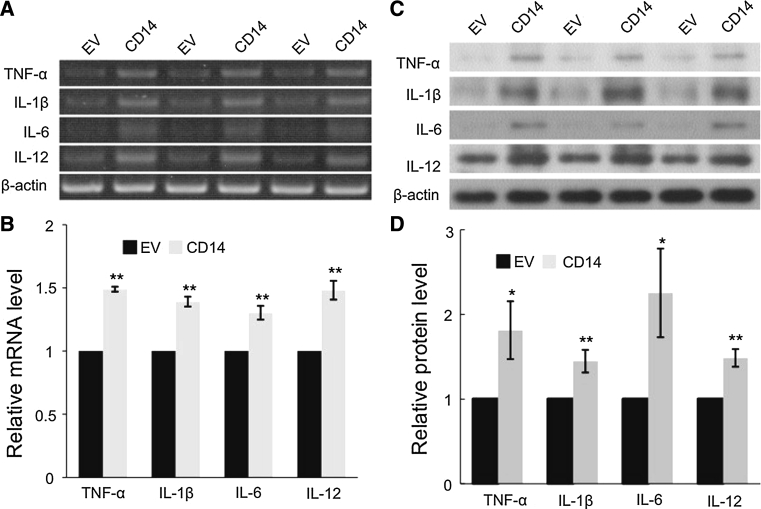
Fig. 5.
CD14 induces pro-inflammatory cytokine expression in SGC-7901 cells. a Representative images of mRNA levels from RT-PCR assay. b Semi-quantitation of (a) by measuring the band intensities using a densitometer. Data are presented as the mean ± SD. **p < 0.01 versus control cells (EV). c Representative images of protein expression from western blot analyses. d Semi-quantitation of (a) by measuring the band intensities using a densitometer. Data are presented as the mean ± SD. *p < 0.05, **p < 0.01 versus control cells

