
Fig. 1.
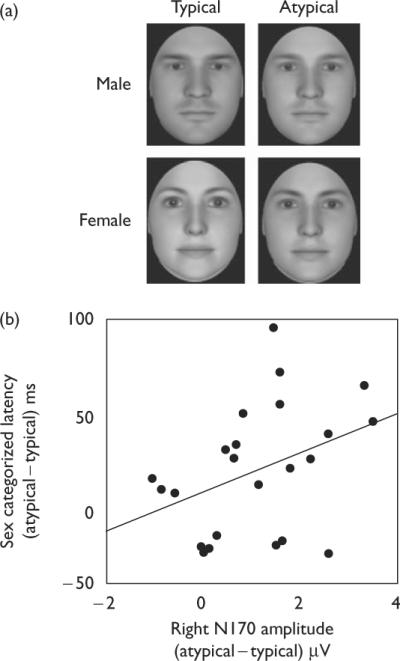
(a) Sample stimuli. (b) Difference score (atypical – typical) of each participant's sex-categorization latencies as a function of each participant's difference score (atypical – typical) of his or her N170 amplitude. The more enlarged the N170 was for sex-typical (relative to sex-atypical) faces, the more efficient sex-typical faces were categorized (relative to sex-atypical faces).