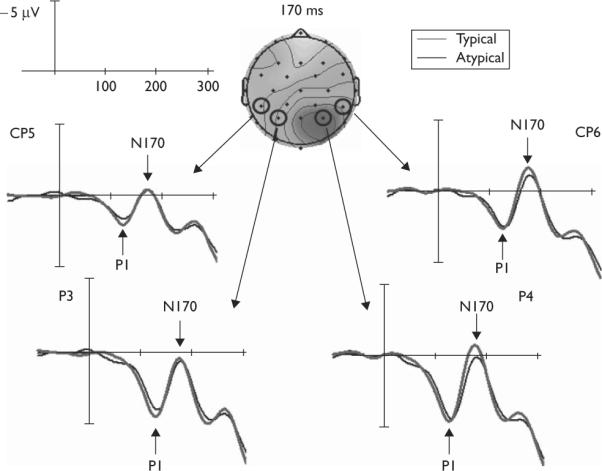
Fig. 2.

Grand-average waveforms for typical and atypical faces at left and right occipito-temporal sites. Negative is plotted upward. In addition, a voltage map showing normalized difference waves (typical – atypical) at 170 ms is depicted. Darker coloring indicates higher negativity for typical faces.
