
Figure 1.
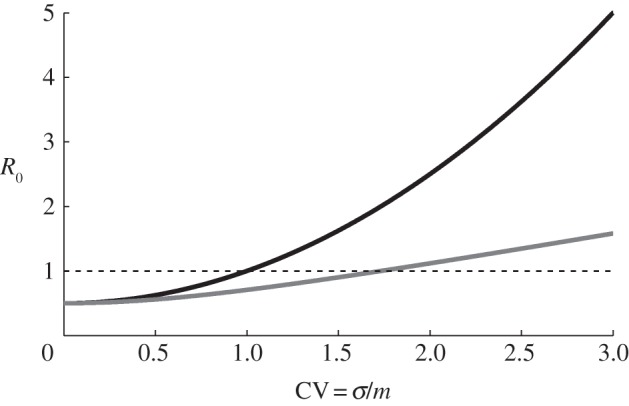
The relationship between the coefficient of variation, CV = σ/m, of the partner acquisition rate distribution and the basic reproductive number, R0, for fixed values of β, D and m. (β = 0.1, D = 5 year and m = 1 yr−1, so that βDm = 0.5). The black curve shows the relationship when there is no distinction between the sexes (R0 = βDm(1 + CV2)) and the grey curve shows the relationship when variation only occurs in one sex (R0 = βDm(1 + CV2)1/2). The dotted line corresponds to the threshold for an epidemic (R0 > 1). Adapted from May et al. [15].