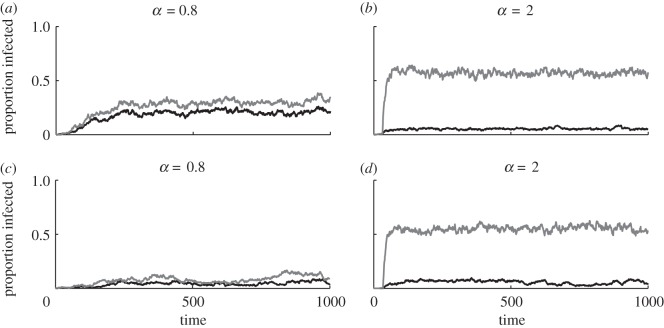
Figure 4.
Dynamics of an SIS-type infection on SCNs for varying degrees of polygamy (α) and movement probabilities (ρ). (a,b) Are examples from a polygynous species, whereas (c,d) are examples from a polyandrous species. Higher values of α correspond to higher variation in the number of partners for the polygamous sex (equation (3.1)). Infection is usually more prevalent in the serially monogamous sex (grey) than in the polygamous sex (black) (parameters: Nm = Nf = 500; β = 0.1; γ = 0.5; κ = 10−4; μ = 0.01; ρ = 0.5; σ = 0.05).

