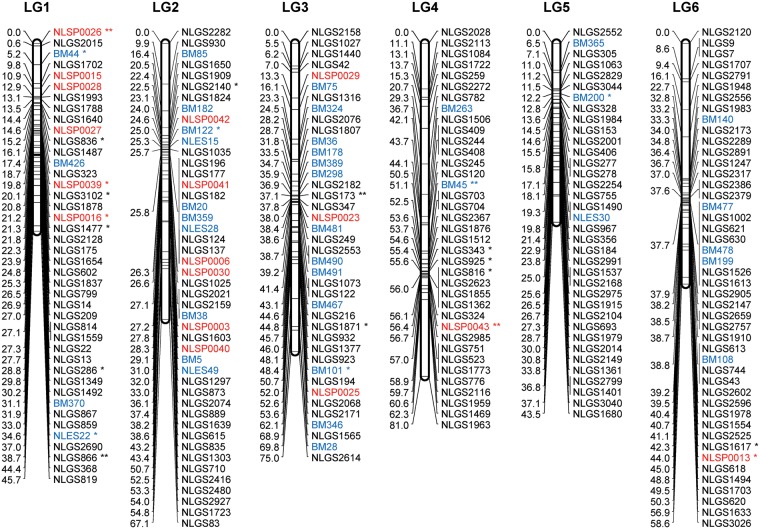
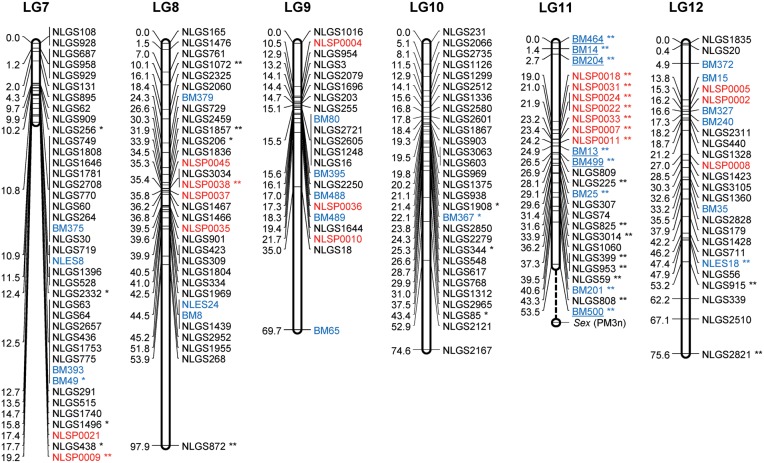
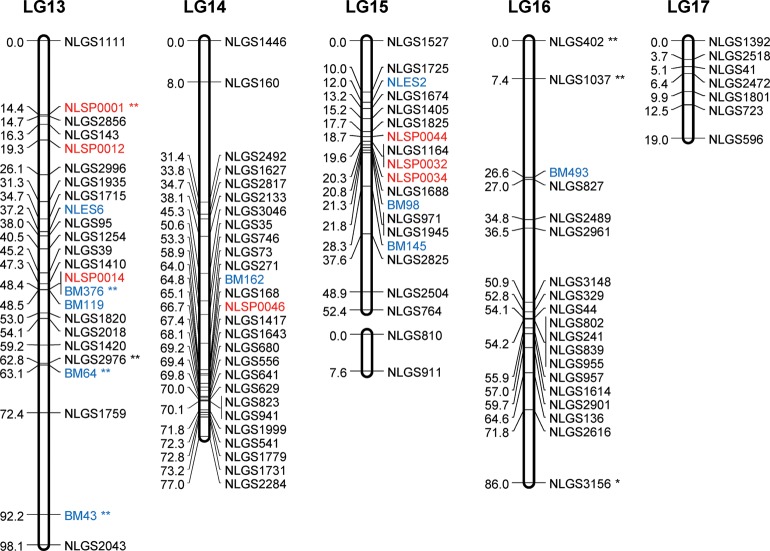
Figure 2.
A genetic linkage map of BPH. The LGs were constructed by integrating linkage data from two backcross populations (KH and CK). Grouping of markers was performed using an independence LOD threshold of five. Groups were converted to maps using the regression algorithm provided by JoinMap, with a recombination frequency smaller than 0.45 and Kosambi's mapping function applied for calculation of map distances. The LGs have been arbitrarily numbered LG1–LG17 based on the order generated by JoinMap (v4.1). Distances in centimorgans are indicated at the left of each LG. Marker names starting with NLGS (black) represent g-SSRs, those starting with NLES and BM represent e-SSRs (blue), and those starting with NLSP (red) represent SNP markers. PM3n is an STS marker located on the Y chromosome. A gap between the marker BM500 and PM3n on the LG11 is expected to include the differentiated region of the Y chromosome. e-SSR markers BM13, BM14, BM204, BM464, BM499, and BM500 are for vitellogenin genes that are genes with female-specific expression located on the X chromosome. Segregation-distorted loci indicate different significant levels; *P < 0.01 and **P < 0.001.


