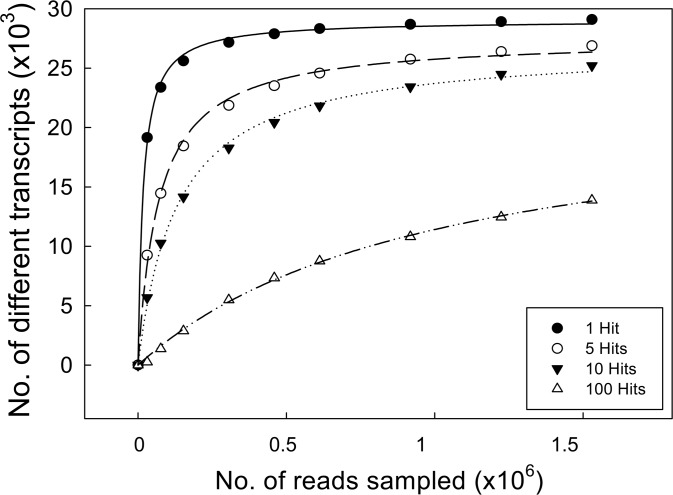
Figure 4.
Rarefaction analysis of gene representation in the assembled dataset. Different numbers of randomly sampled reads were blasted against the SOLLC protein database, and the number of proteins identified at least 1time, 5, 10 and a 100 times was recorded. The resulting data were modelled with non-linear regression y = (ax)/(b–x).

