Figure 5.

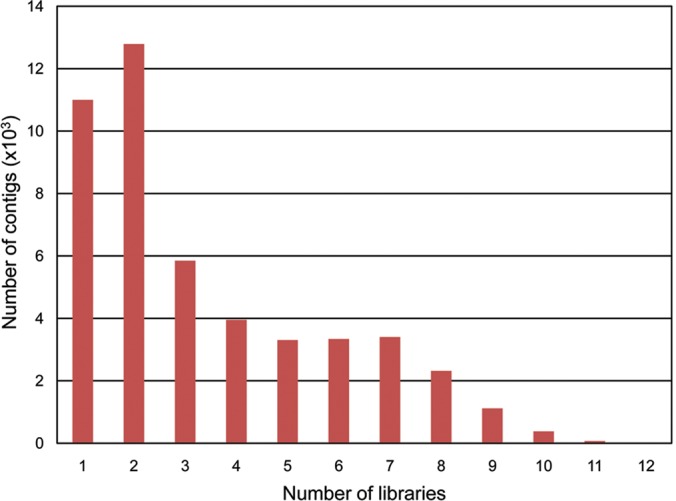
Distribution of number of libraries providing reads per contig. The total number of contigs generated in this work was analysed.

Distribution of number of libraries providing reads per contig. The total number of contigs generated in this work was analysed.