
Figure 6.
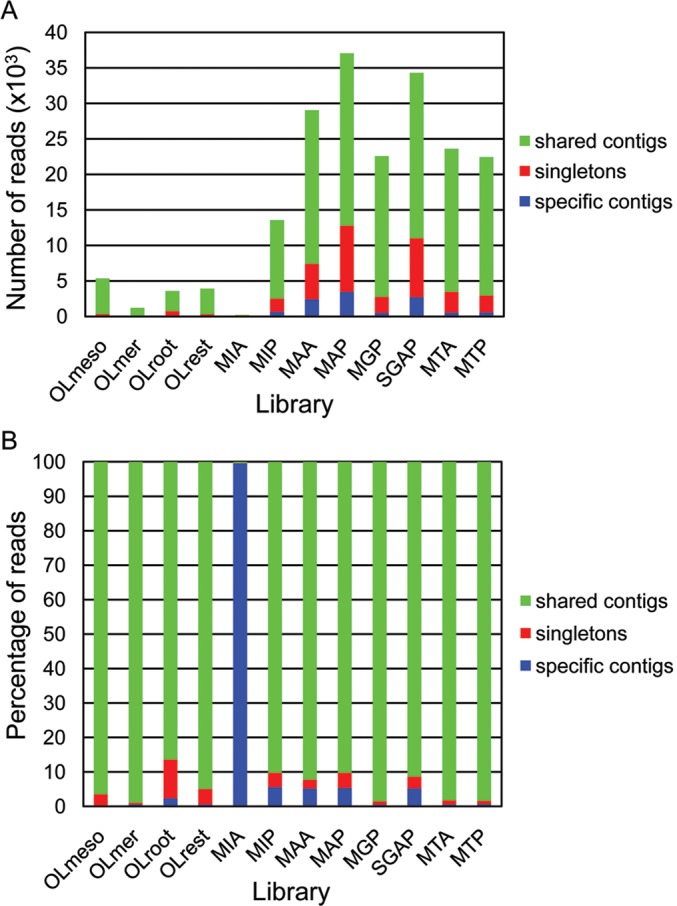
Distribution of number of reads contributing to the singleton category, or contributing to either library-specific or shared contigs, per library. (A) Numbers indicated correspondence to the actual number of reads of the libraries. (B) Numbers of reads per category have been normalized to the total number of reads per library. The number (A), or percentage (B), of contigs shared by more than one library is represented in green, contigs formed by reads from a single library are shown in blue, and singletons in red.