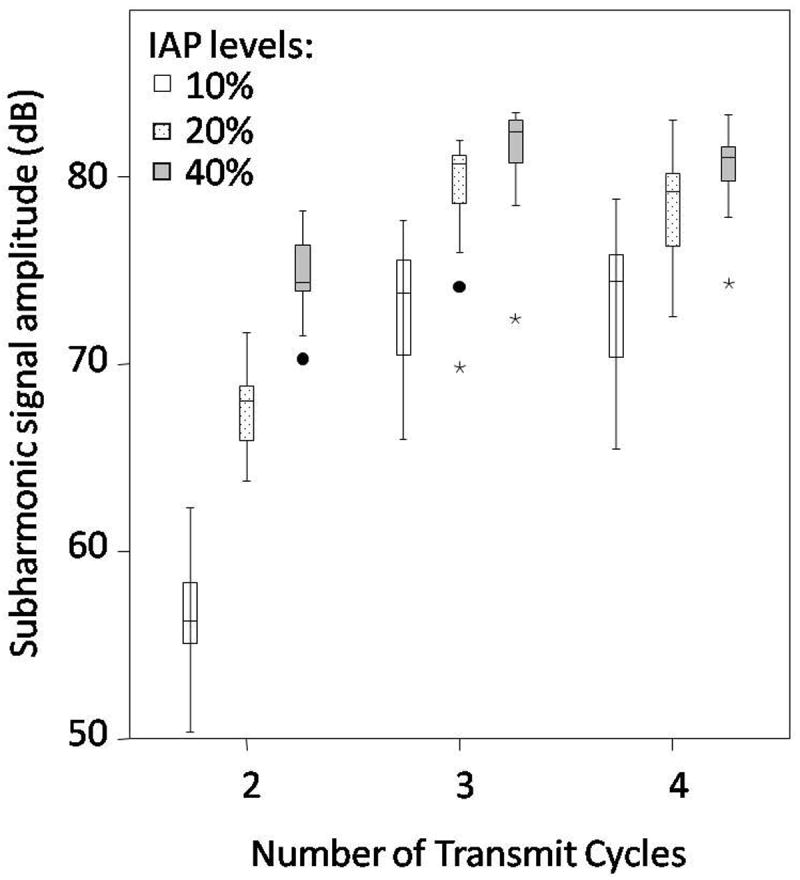
Fig. 5.

Boxplot of the subharmonic signal amplitudes obtained at 10 %, 20 % and 40 % incident acoustic power (IAP) levels with 2, 3 and 4 transmit cycles. Minor and major outliers are indicated with circles and asterisks, respectively. Note, that the subharmonic signal amplitudes obtained with 10 % IAP and with 2 cycles are relatively low as compared to the amplitudes obtained with 20 % and 40 % IAP, for 3 and 4 transmit cycles.
