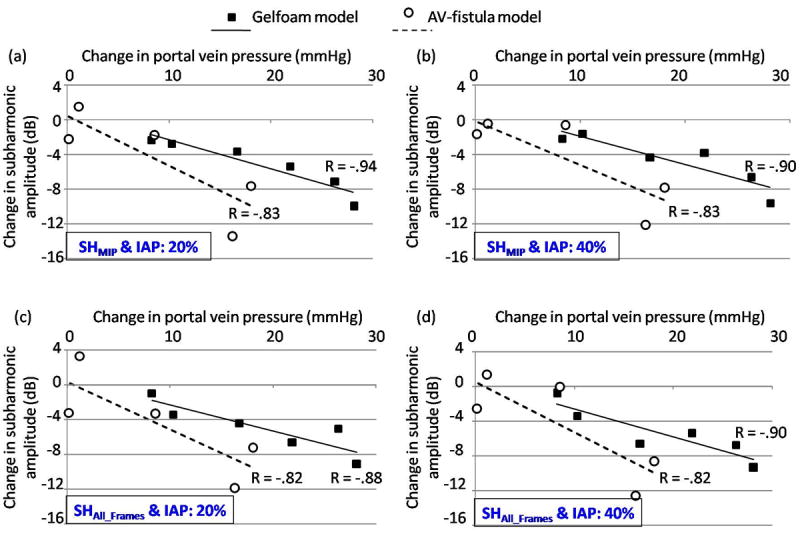
Fig 8.

Mean changes in the portal vein pressures are plotted with mean changes in subharmonic signal amplitudes acquired with 4 transmit cycles along with the best-fit line and the correlation coefficient is indicated for both the Gelfoam and AV-fistula portal hypertension models. (a) and (c) represent data acquired at 20 % incident acoustic power (IAP) for subharmonic signal analyzed from the MIP image (SHMIP) and as the mean value from all the frames (SHAll_Frames), respectively. (b) and (d) represent the corresponding data acquired at 40 % IAP.
