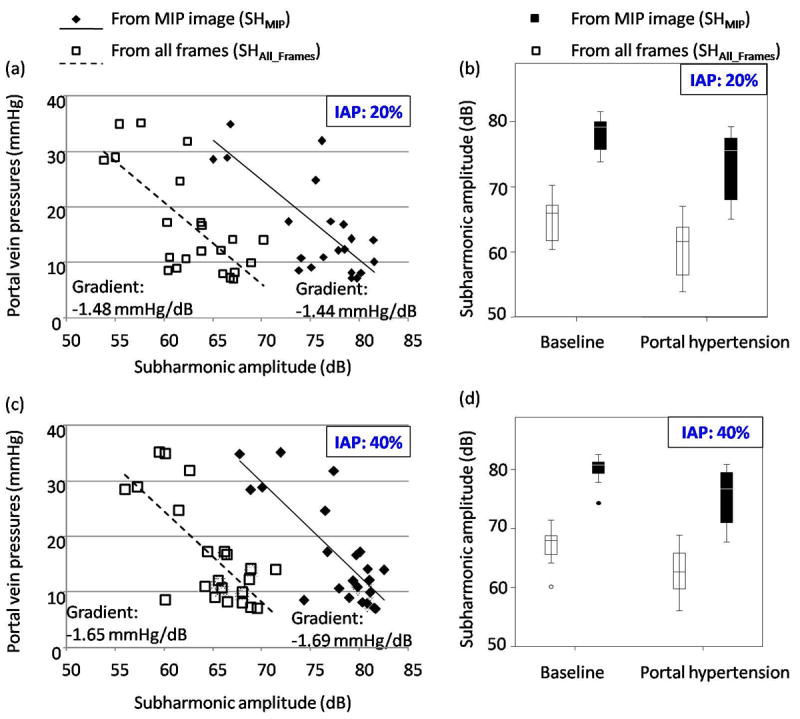
Fig 9.

Absolute portal vein pressures are plotted with absolute subharmonic signal amplitudes acquired with 4 transmit cycles (note, these are mean values obtained from each canine). (a-b) and (c-d) represent data acquired at 20 % and 40 % incident acoustic powers (IAPs), respectively. The subharmonic amplitudes obtained from the maximum intensity projection images (SHMIP) and from the mean signal combined from all the frames (SHAll_Frames) are shown separately in each panel. The best-fit line along with its gradient is indicated in (a) and (c). Boxplots in (b) and (d) indicate the interquartile range (vertical span of the box), the median value (horizontal line within the box), the range (whiskers) and minor outliers (circles) for the subharmonic signal amplitudes. Note that the SHAll_Frames is relatively less than the SHMIP (as expected).
