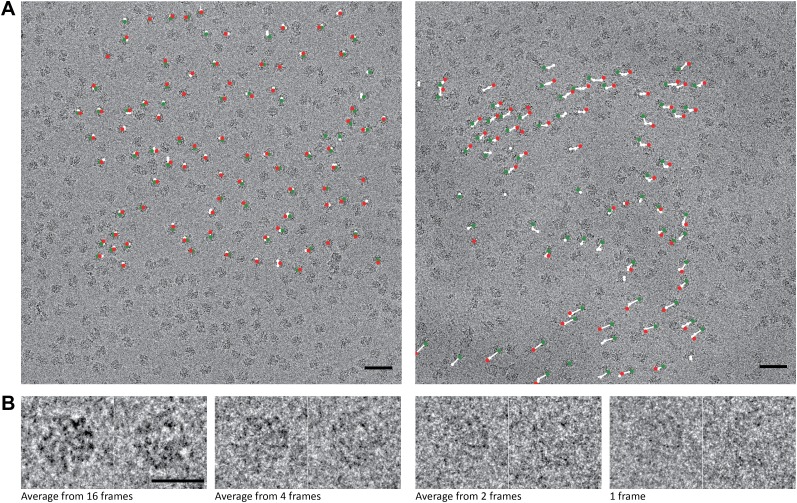
Figure 1. 70S data collected on a back-thinned FEI Falcon detector.
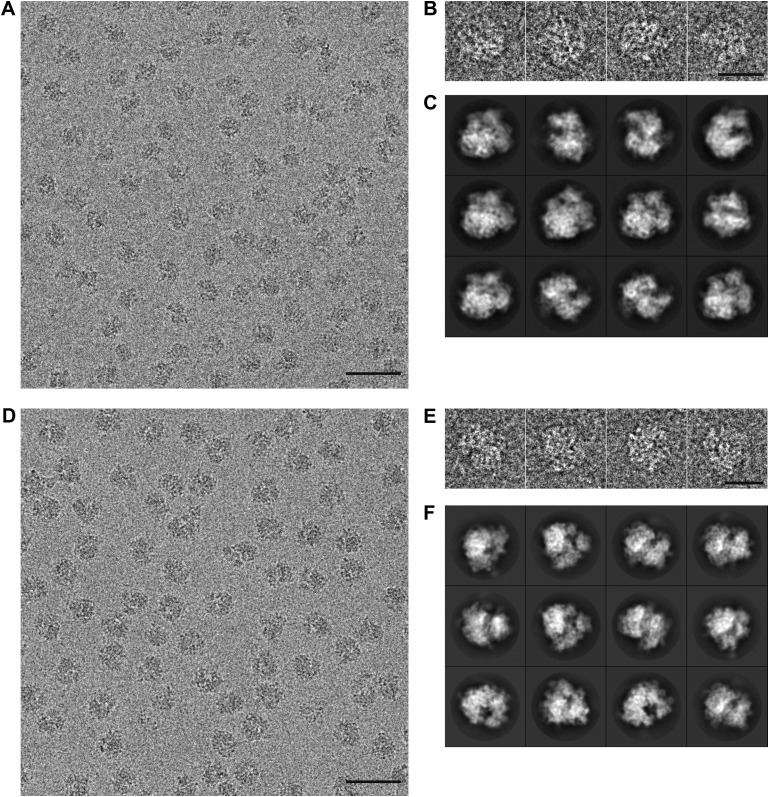
(A) The 16-frame (1-s) average of two untilted videos. The scale bar indicates 50 nm. Relative positions for independently aligned four-frame averaged particles are shown with circles connected by white lines. The relative position of the average from the first four frames is shown in green, the relative position of the last four frames in red. The differences between these relative positions are exaggerated 25 times for improved clarity, and only those four-frame averages for which correct alignment was confirmed by tilt-pair analysis are included. Movements in the area on the left are smaller (up to 1.5 Å) then in the area on the right (up to 10 Å). (B) Examples of two individual ribosome particles as averages over a decreasing number of video frames. The scale bar indicates 20 nm. Zoomed-in areas of micrographs, additional individual particles and reference-free 2D class averages for both the 70S and 80S data are shown in Figure 1—figure supplement 1.


