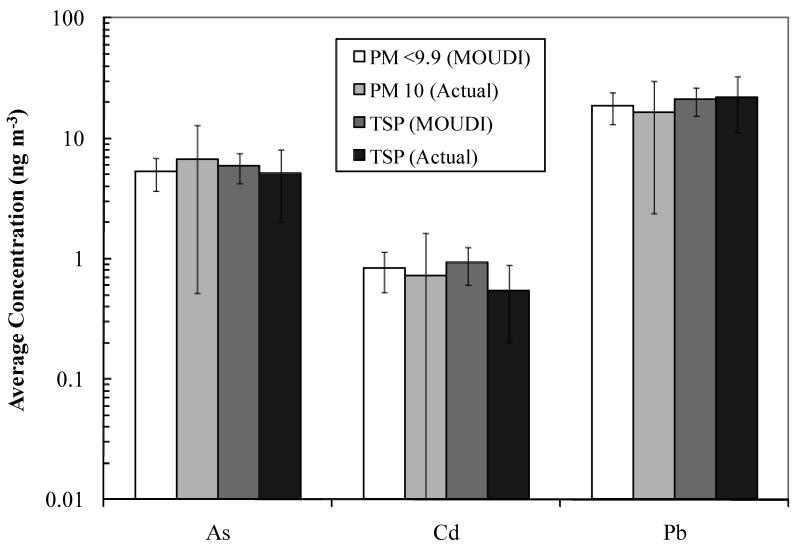
Figure 4.
Comparisons of metal and metalloid content of MOUDI samples with PM10 data from EPA, and TSP observations at the Hayden site. Samples were taken between December 2008 and November 2009 for 36 and 55 sampling periods for the MOUDI and PM10 monitor, respectively. The TSP concentrations were averaged for 18 sampling periods spanning July 2009 to March 2010. Sampling periods may not have occurred on the exact same days. For MOUDI samples, PM9.9 represents the average of the summed mass concentrations in the corresponding size range, and TSP represents the average total concentration.

