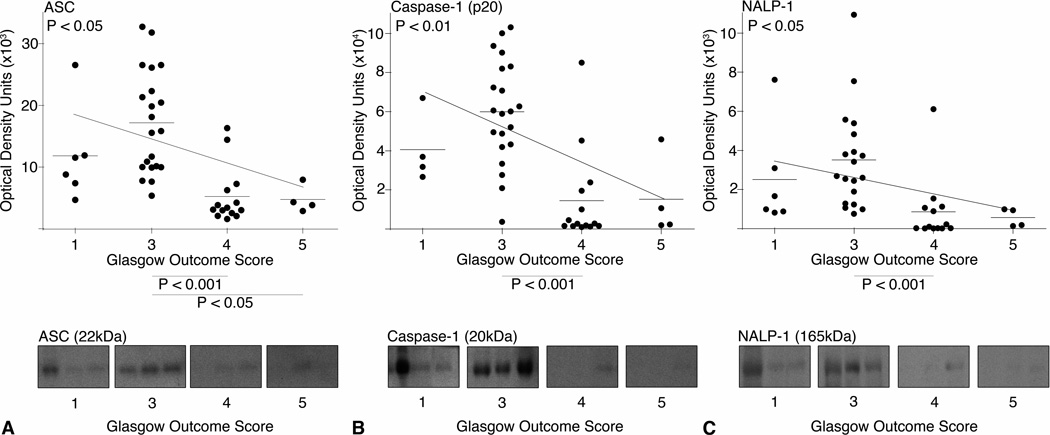
Fig. 3.
Scatter plots and estimated linear regression of (A) ASC, (B) Caspase-1 (p20), and (C) NALP-1 expression in the CSF with GOS. P values of the linear regression are shown in the top left of each graph. Expression of each protein correlated significantly with GOS at 5 months post-injury. The P values on the X-axis represent post-hoc comparisons of a Kruskal-Wallis test. Representative immunoblots are shown. Samples were run on the same gel but were noncontiguous.

