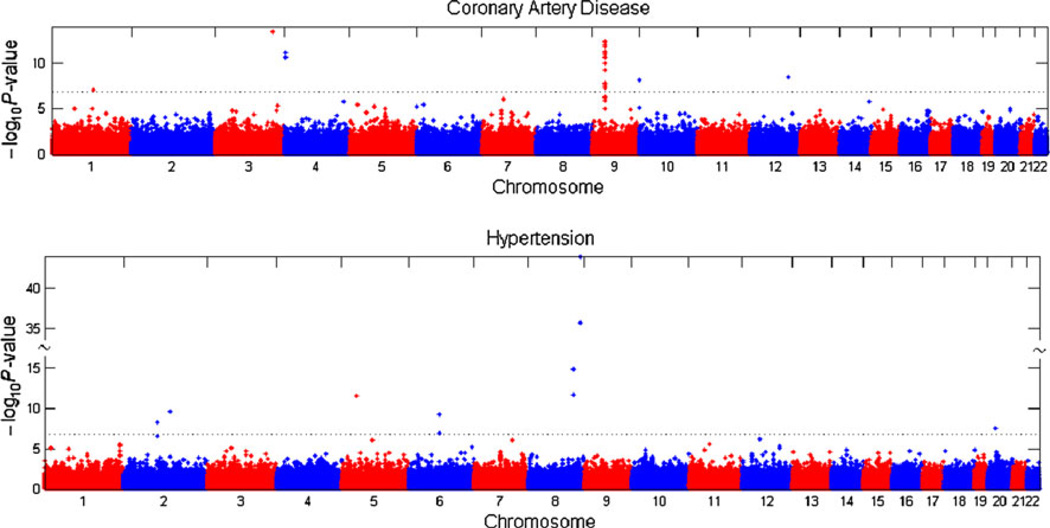
Fig. 3.
Manhattan plots of 2 df test results for CAD and HTN. Two df Manhattan plots for CAD and HTN are as marked. Three df testing methods yielded the same loci with the exception of one additional chromosome 10 SNP pair for CAD marked by the asterisk in Table 1

