
Figure 5. Leaky Integration of Movement Neuron Activity.
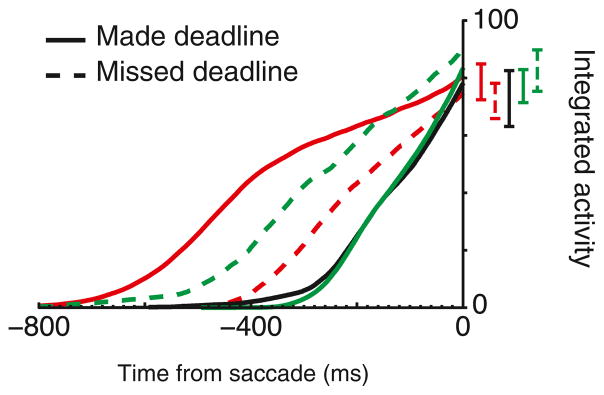
Average activity of all movement neurons when the target appeared in the RF on correct trials, integrated with a decay constant of 100 ms from array presentation until saccade initiation. Integrated values 20–10 ms before saccade initiation were not significantly different between SAT conditions, even when the RT deadline was missed (all p > 0.05, linear regression). Invariance of integrated values at saccade initiation was observed with time constants of 7–167 ms. Vertical bars represent ±1 SE.