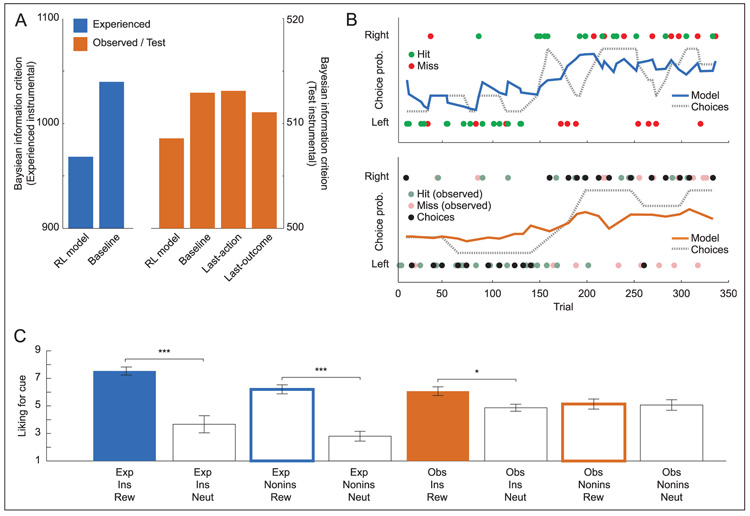
Figure 2.
Conditioning for experienced and observed outcomes. (A) Model fit for RL model of instrumental learning compared with alternative models. Fit is measured by BIC (smaller indicates better fit). See Results for model details. Saturated model not shown for clarity. (B) Time course of instrumental choices and RL model predictions for single representative participant. Top: Experienced trials. Circles indicate choice of left or right action (top or bottom of y axis); color indicates reward or neutral outcome. Dashed line indicates average choice probability over previous four trials at each time point (a smoothed measure of behavior). Solid line indicates model-predicted choice probability at each time point. Bottom: Observed and Test trials. Colored circles indicate Observed confederate choices; color indicates reward or neutral outcome for confederate. Dark circles indicate participant Test-trial choices, which were performed in extinction (without any outcome during scan). Lines indicate average Test-trial choice probability and model predictions. (C) Average self-reported liking for cues after experiment. Exp = Experienced, Obs = Observed, Ins = instrumental, Nonins = Noninstrumental, Rew = reward cue, Neut = neutral control. Error bars indicate SEM across participants. Only significant differences between reward cue and neutral control machines within condition are shown. ***p < .001, *p < .05.

