
Figure 3.
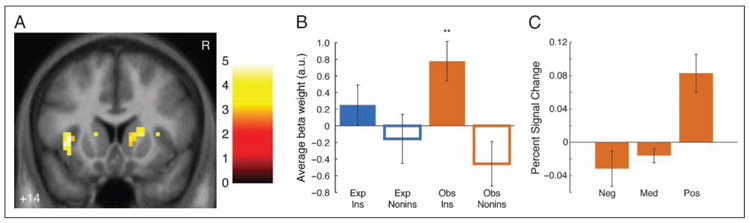
Dorsal caudate activation for Observed instrumental prediction errors. (A) Activation for Observed instrumental prediction error regressor. Maps are thresholded at p < .005 voxelwise with 5 voxel extent threshold for display; cluster in right dorsal caudate meets extent threshold corrected for multiple comparisons across dorsal striatum. Coordinates are in ICBM/MNI space. Color bar indicates t statistic. R indicates right. (B) Average beta weights (calculated with leave-one-out extraction; see Methods) in significant dorsal caudate cluster. Error bars indicate SEMs across participants. Only significant differences from baseline shown; between-condition tests show only main effect of instrumental versus noninstrumental conditions (F(1, 63) = 12.65, p < .005). **p < .01. (C) Dorsal caudate activation by prediction error size. Bars indicate estimated effect size (in percent signal change) in significant dorsal caudate cluster (calculated with leave-one-out extraction) for outcomes on instrumental Observed trials by prediction error size and valence. Effect sizes estimated as canonical hemodynamic response peak, adjusted for all other conditions (Gläscher, 2009). Neg = prediction error < −0.33. Med = prediction error ≥ −0.33 and < 0.33. Pos = prediction error ≥ 0.33. Significant differences are not shown. Error bars are SEM across participants.