
Figure 4.
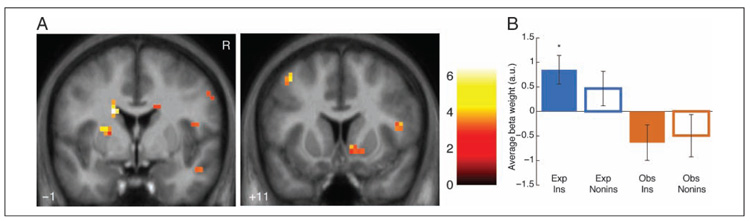
Dorsal and ventral striatum activation for Experienced instrumental prediction errors. (A) Activation for Experienced instrumental prediction error regressor. Ventral striatal cluster (right) meets extent threshold corrected for multiple comparisons across ventral striatum. Maps are thresholded at p < .005 voxelwise with 5 voxel extent threshold for display. Coordinates are in ICBM/MNI space. Color bar indicates t statistic. R indicates right. (B) Average beta weights (calculated with leave-one-out extraction; see Methods) in significant dorsal putamen cluster. Error bars indicate standard errors of the mean across participants. Only significant differences from baseline shown; between-condition tests show only main effect of Experienced vs. Observed conditions (F(1, 63) = 11.64, p < .005). *p < .05.