Fig. 1.
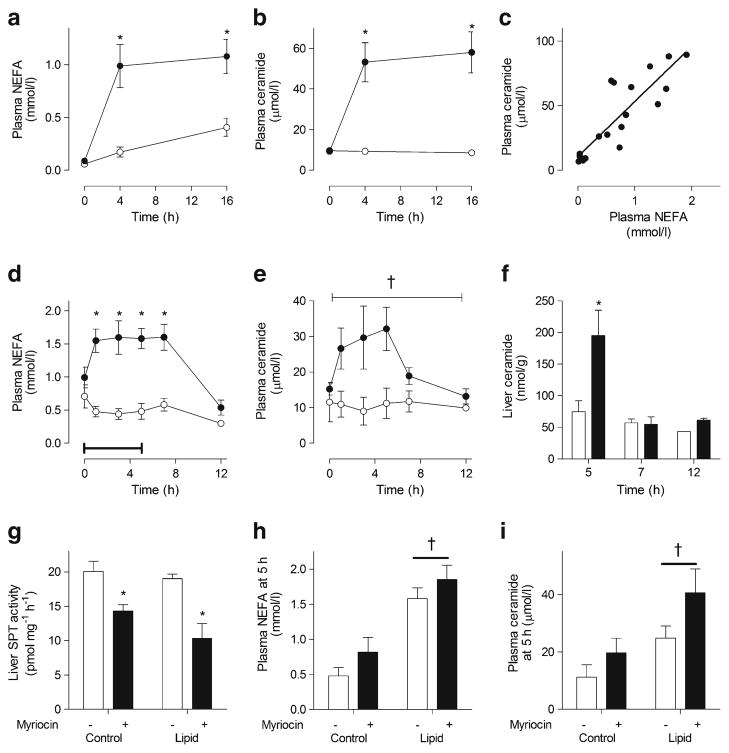
Lipid infusion increases plasma NEFA and ceramide levels. (a, b) plasma NEFA and ceramide levels in humans infused with either saline (control, white) or lipid and heparin (lipid, black) *p<0.05 vs control (by two-way ANOVA); n=7 per group. (c) Linear regression analysis of NEFA and ceramide levels in humans infused with lipid and heparin. R2=0.75, p<0.0001. (d, e) plasma NEFA and ceramide levels in rats infused with either 2.5% glycerol (control, white) or lipid and heparin (lipid, black) for 5 h. Bar represents the duration of infusion. (f) Liver ceramide content, *p<0.05 vs control, †p<0.05 main effect of infusion (by two-way ANOVA), n=4–14. (g) Maximal ex vivo liver SPT activity, (h) plasma NEFA, (i) ceramide levels in rats infused with either 2.5% glycerol (control) or lipid and heparin (lipid) for 5 h, administered 100 μg/kg myriocin i.v. 5 min prior to infusion (black) or saline (white). *p<0.05 vs no myriocin; †p<0.05 main effect of infusion; n=5–8 per group. Values are mean±SEM

