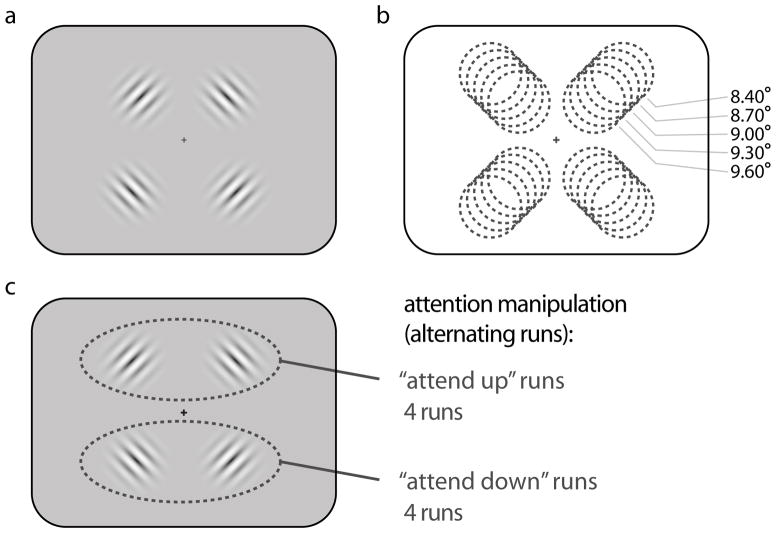
Figure 1. Stimuli and experimental design.
a) The stimuli consisted of four Gabor patches in the four visual quadrants. b) The Gabors appeared at five possible eccentricities, ranging from 8.40 deg. to 9.60 deg. From trial to trial, the positions of the upper two Gabors varied independently of the positions of the lower Gabors. c) In alternating runs, subjects were instructed to attend to the Gabors in either the upper visual field or the lower visual field, to detect slight contrast decrements in the stimuli.

