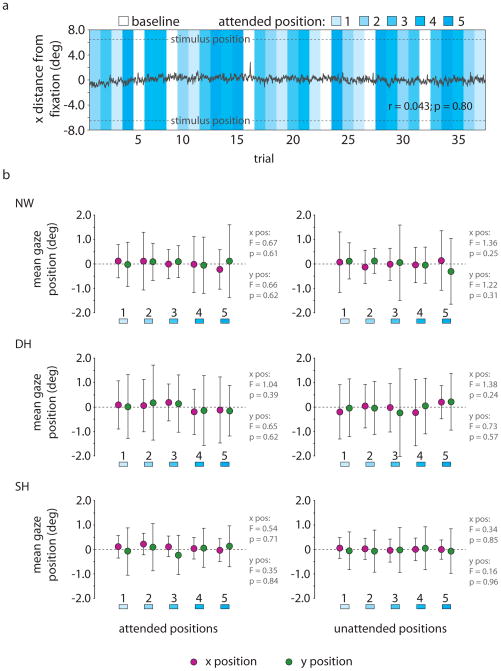
Figure 2. Analysis of eye position data.
a) Example eye trace, showing the horizontal eye position across one run for subject DH. Shades of blue indicate the position of the attended stimuli on each trial. For this run, the correlation between mean horizontal eye position within each block and the stimulus eccentricity was r = 0.043 (p = 0.80; based on 36 blocks per run; df = 34). The correlation between eye position and stimulus condition was not significant for any run, for either the attended or ignored stimuli. b) Mean eye position is shown for each of the five attended positions and the five ignored positions separately for each subject. Error bars are the standard deviation of the eye position measurements within each bin. We ran four one-way ANOVAs within each subject, testing for a systematic difference in horizontal or vertical eye position across the five stimulus locations for either the attended or ignored stimuli. None of these tests showed significant differences in eye position across the five stimulus locations (most significant was in subject DH for the ignored stimulus locations x horizontal eye position: F4,119995 = 1.38, p = 0.24; all p values reported reflect tests for a main effect of eye position across the five stimulus locations, with 120,000 total eye position measurements). These results rule out the influence of systematic eye movements on our results.

