
Figure 3. Parallel analysis of the attended and ignored stimuli in the BOLD response.
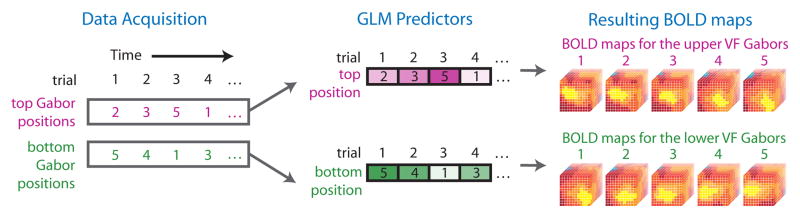
In order to separately isolate the patterns of activity corresponding to the attended stimuli and the ignored stimuli, we fit each functional run with two separate general linear models. One had predictors coded according to positions of the Gabors in the upper visual field (shown in purple), while the other had predictors coded according to positions of the Gabors in the lower visual field (shown in green). By separately contrasting each of the five stimulus positions against a fixation baseline in each GLM, we generated ten maps of BOLD response: five corresponding to positions of the stimuli in the upper visual field, and five corresponding to the positions of the stimuli in the lower visual field. This approach allowed us to tease apart information about the attended and ignored stimulus positions within the same set of voxels by using two separate and independent encoding models, each of which explained a unique portion of the pattern of activity in the Pulvinar ROI.