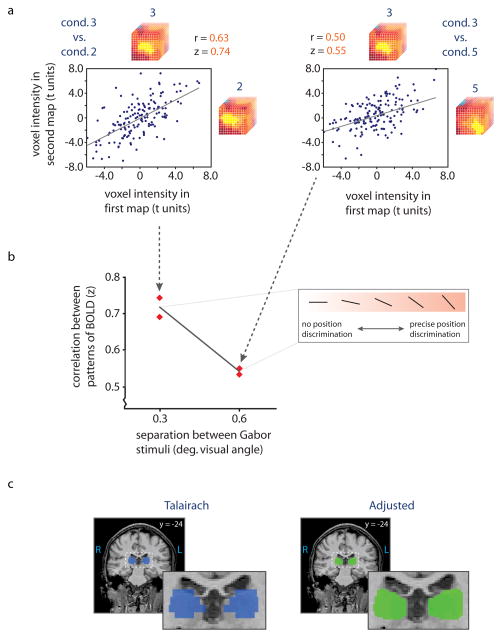
Figure 4. Correlation-based analysis of position selectivity.
a) We computed the pairwise correlations between the patterns of activity produced by the five stimulus positions (the central condition vs. each of the other conditions). Each point on the plot represents one voxel, its value from the first BOLD map plotted against its value from the second BOLD map. We then tested for a trend in the correlations indicating position selectivity by plotting them as a function of the visual distance between the corresponding stimuli (b). A negative trend in the plot of correlation values indicates that as the stimuli became more retinotopically distinct, they produced more distinct multivariate patterns of activity20. A steeper negative slope on the plot indicates more precise encoding of stimulus position. c) To generate regions of interest for the pulvinar, we used the coordinates for the pulvinar drawn from the Talairach Atlas21 (shown in blue), and made minor adjustments to match the ROIs to each subject’s individual anatomy (an example adjusted ROI is shown in green).

