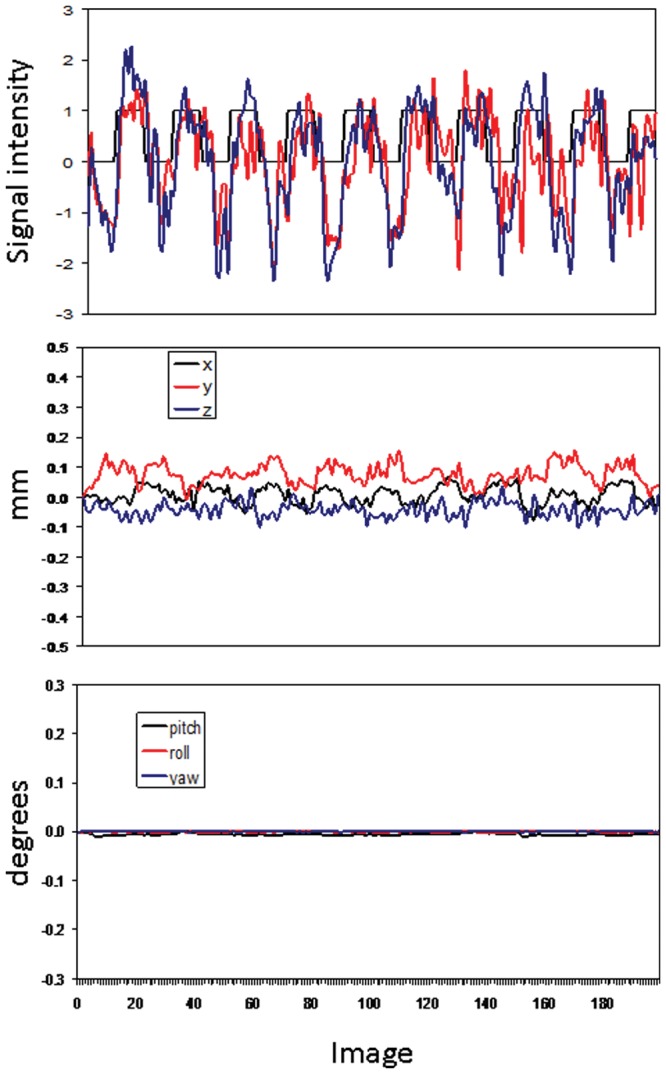
Figure 1.

Example data from one participant. The horizontal axis for all 3 plots is the number of images in sequential order. Top: BOLD signal sampled from the left motor cortical seed (black) and from the region in the right motor cortex that showed functional connectivity with the left seed (gray). The vertical axis is signal intensity in arbitrary units. The gray square-wave in the plot shows the block design; rest blocks occurred when the square wave is at zero, and chew blocks occurred during the time periods when the square wave is at unity. The reported functional connectivity results are based on temporal correlations unique to the chewing blocks, e.g., images 10-20, 30-40, 50-60…170-180, 190-200. Middle and bottom: Plots of movement parameters for one participant showing translation (middle) and rotational (bottom) movement artifacts.
