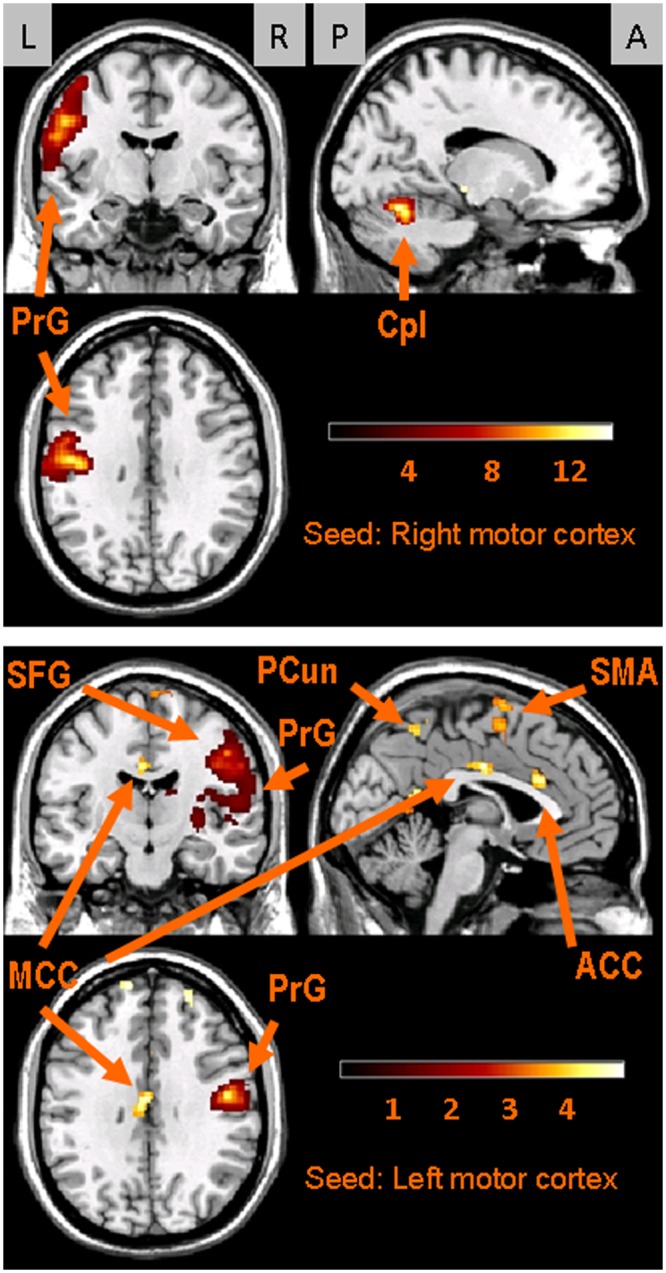
Figure 2.

Images of the functional connectivity maps for the seeds in the motor cortices. Upper panel: Results for the right motor cortex seed. Three sections are shown in the upper panel: top left, coronal (y = -8); top right, sagittal (x = -16); and bottom left, axial (z = 32). Lower panel: Results for the left motor cortex seed. The 3 sections in the lower panel are: top left, coronal (y = -14); top right, sagittal (x = 4); and bottom left, axial (z = 32). The gray rectangles at the top of the Fig. indicate participant orientations, viz., L, left; R, right; P, posterior; and A, anterior (for axial sections, anterior is toward the top of the page). Color-coded bars display z-scores; results are based on voxel-level, p < 0.001, uncorrected. Key: Anterior cingulate cortex (ACC); cerebellum posterior lobe (Cpl); middle cingulate cortex (MCC); pre-central gyrus (PrG); precuneus (PCun); superior frontal gyrus (SFG); supplementary motor area (SMA). The labels indicate where the peak values occurred; however, several clusters expand into other areas that are not named in the Fig. (see text and Table).
