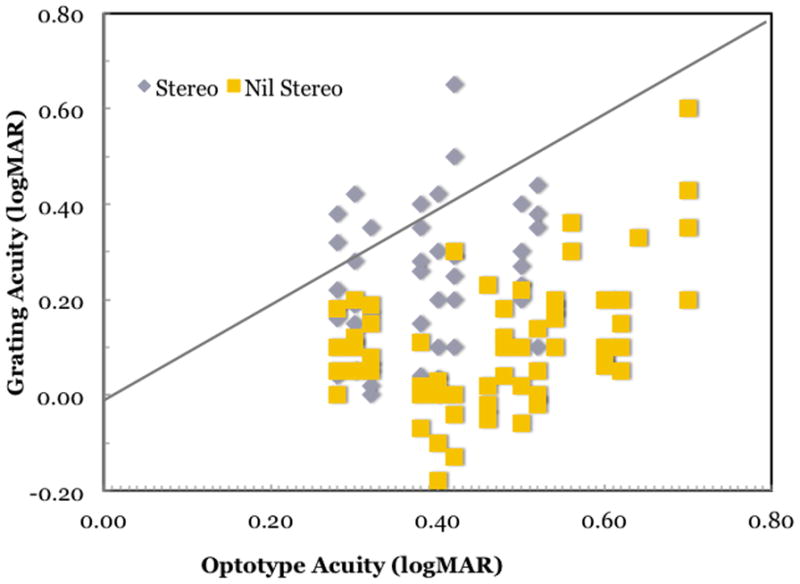
Figure 6.

Grating and optotype acuities for 106 children with mild-to-moderate amblyopia.(Bosworth and Birch, 2003) Amblyopic children with preserved stereopsis (grey symbols) fall near the 1:1 line (gray line), consistent with similar loss of grating acuity and optotype acuity. Amblyopic children with nil stereoacuity (yellow symbols) fall to the right of the 1:1 line, consistent with similar greater loss optotype acuity of optotype acuity than grating acuity. The mean optotype grating acuity difference was 0.13 ± 0.13 logMAR for amblyopic children with preserved stereopsis and 0.22 ± 0.16 logMAR for amblyopic children with nil stereoacuity (F1,104 = 10.4; p = 0.0016).
