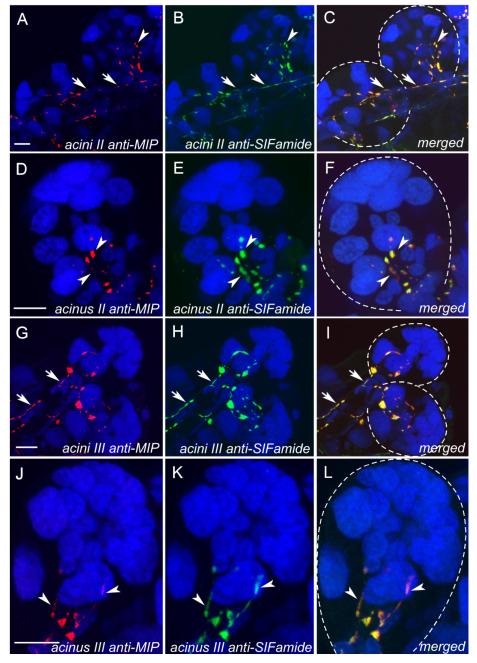
Figure 6.
Colocalization of MIP-IR (red in the first column; A,D,G,J) and SIFamide-IR in projections (green in the second column; B,E,H,K), and merged images (third column; C,F,I,L) of the salivary glands. Blue is nuclei staining for DAPI. Two different magnifications for acini II (A–F) and acini III (G–L) are shown. D–F and J–L are higher magnifications. Arrows indicate axons running along the salivary duct, and arrowheads indicate the varicosities of the axon terminal branches in acini. This figure is repeated as Supporting Information Figure 2, with the red-green double label replaced by magenta-green. Scale bars = 10 μm in A (applies to A–C); 10 μm in D (applies to D–F); 10 μm in G (applies to G–I); 10 μm in J (applies to J–L).

