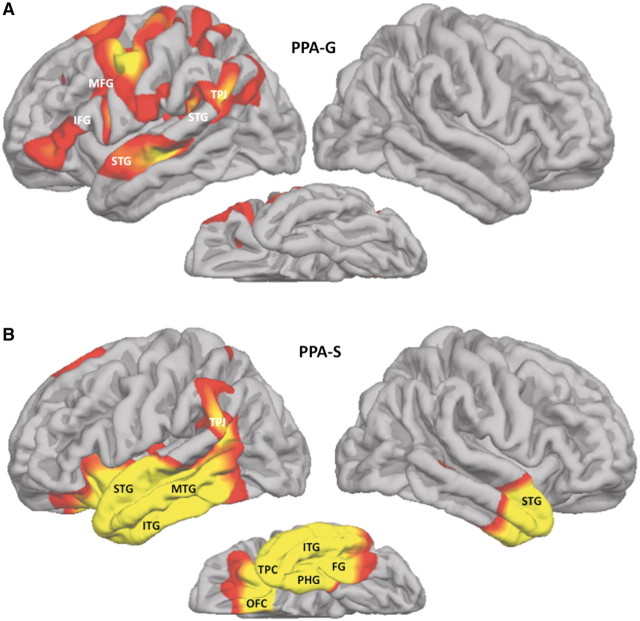
Figure 3.
Atrophy patterns in PPA-G and PPA-S. Red and yellow areas designate peak atrophy sites at False Discovery Rate = 0.05, full-width at half-maximum = 20 when patient groups were compared to a normal control group of 27 subjects. FG = fusiform gyrus; IFG = inferior frontal gyrus; ITG = inferior temporal gyrus; MFG = middle frontal gyrus; MTG = middle temporal gyrus; OFC = orbitofrontal cortex; PHG = parahippocampal gyrus; STG = superior temporal gyrus; TPC = temporopolar cortex; TPJ = temporoparietal junction.

