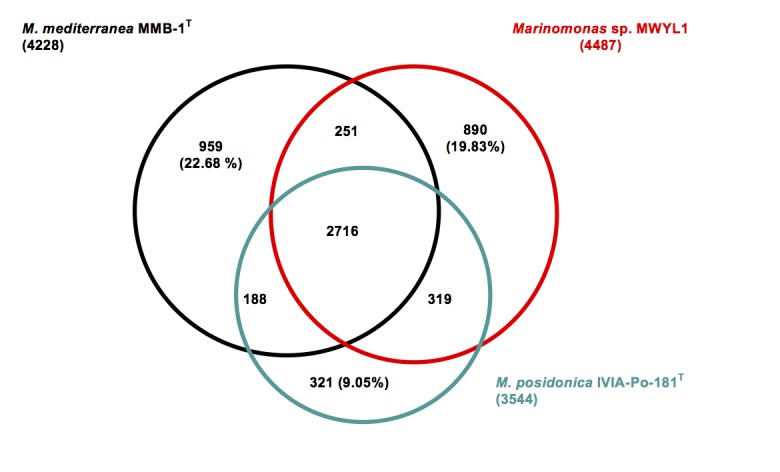
Figure 4.

Venn-diagram showing the intersection of proteins sets (total number in parenthesis) of the three completed Marinomonas genomes. The intersections were calculated using the IMG tool phylogenetic profiler with default values (E value 1 e-5 and 30% minimum identity). All intersections concerning M. posidonica IVIA-Po-181T are gene counts in this strain. The remaining intersection between M. mediterranea and Marinomonas sp. MWYL1 represents gene counts in M. mediterranea. In some cases, the intersections do not add to total numbers of genes, due to the dependence of the results on the strain used as query.
